Da Vinci Firmware 1
Firmware for the DaVinci-M rocket avionics board.
Loading...
Searching...
No Matches
profiler.h File Reference

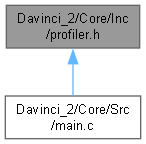
DWT-based microsecond profiler for ARM Cortex-M microcontrollers. More...

#include "main.h"
Include dependency graph for profiler.h:
This graph shows which files directly or indirectly include this file:

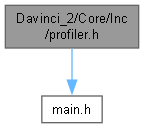
Go to the source code of this file.

Data Structures

struct  ProfileResult
 

Macros

#define ENABLE_PROFILING
 
#define PROFILER_START(p_result)   (p_result)->start_time = DWT->CYCCNT
 
#define PROFILER_STOP(p_result)
 

Functions

void initDWT (void)
 Initializes the DWT (Data Watchpoint and Trace) cycle counter.
 

Detailed Description

DWT-based microsecond profiler for ARM Cortex-M microcontrollers.

Author
Francesco Abate
Date
2025-09-25

This header provides a set of macros to easily measure the execution time of code blocks with high precision using the DWT cycle counter.

— HOW TO USE —

  1. Initialize the counter once at the beginning of your main() function by calling:
    PROFILER_INIT();
  2. In the function where you want to measure code, declare a ProfileResult variable:
    ProfileResult my_measurement;
  3. Wrap the code you want to measure with the PROFILER_START and PROFILER_STOP macros:
    PROFILER_START(&my_measurement);
    // ... your code to be timed goes here ...
    PROFILER_STOP(&my_measurement);
    #define PROFILER_STOP(p_result)
    Definition profiler.h:97
    #define PROFILER_START(p_result)
    Definition profiler.h:94
  4. Access the results from the my_measurement variable. The results are available in cycles, nanoseconds, microseconds, and milliseconds.
    printf("Task took: %.3f ms\n", my_measurement.elapsed_ms);
    printf("Cycles: %lu, Time: %.3f us\n", my_measurement.elapsed_cycles, my_measurement.elapsed_us);
    uint32_t elapsed_cycles
    Total CPU cycles elapsed.
    Definition profiler.h:87
    float elapsed_us
    Elapsed time in microseconds.
    Definition profiler.h:89
    float elapsed_ms
    Elapsed time in milliseconds.
    Definition profiler.h:90
  5. To disable profiling for a release build, simply comment out the #define ENABLE_PROFILING line below. All profiling macros will compile to nothing, adding zero overhead.

Definition in file profiler.h.

Macro Definition Documentation

◆ ENABLE_PROFILING

#define ENABLE_PROFILING

Definition at line 50 of file profiler.h.

◆ PROFILER_START

#define PROFILER_START (   p_result)    (p_result)->start_time = DWT->CYCCNT

Definition at line 94 of file profiler.h.

◆ PROFILER_STOP

#define PROFILER_STOP (   p_result)
Value:
do { \
(p_result)->elapsed_cycles = DWT->CYCCNT - (p_result)->start_time; \
float clock_period_ns = 1000000000.0f / SystemCoreClock; \
(p_result)->elapsed_ns = (float)(p_result)->elapsed_cycles * clock_period_ns; \
(p_result)->elapsed_us = (p_result)->elapsed_ns / 1000.0f; \
(p_result)->elapsed_ms = (p_result)->elapsed_us / 1000.0f; \
} while(0)
uint32_t SystemCoreClock

Definition at line 97 of file profiler.h.

Function Documentation

◆ initDWT()

void initDWT ( void  )

Initializes the DWT (Data Watchpoint and Trace) cycle counter.

This function enables the high-precision cycle counter available on ARM Cortex-M processors (M3, M4, M7, etc.). It is used for creating very short, accurate delays or for performance profiling. The counter increments on every CPU clock cycle.

It performs the following steps:

  1. Enables the Trace module via the CoreDebug peripheral.
  2. Resets the cycle counter to zero.
  3. Enables the cycle counter.
Note
This function must be called once at startup before any functions that rely on the DWT counter (e.g., DWT_Delay_us()).

Definition at line 70 of file profiler.h.

70 {
71 CoreDebug->DEMCR |= CoreDebug_DEMCR_TRCENA_Msk; // Enable trace
72 DWT->CYCCNT = 0; // Reset the counter
73 DWT->CTRL |= DWT_CTRL_CYCCNTENA_Msk; // Enable cycle counter
74}

Referenced by main().

Here is the caller graph for this function: